
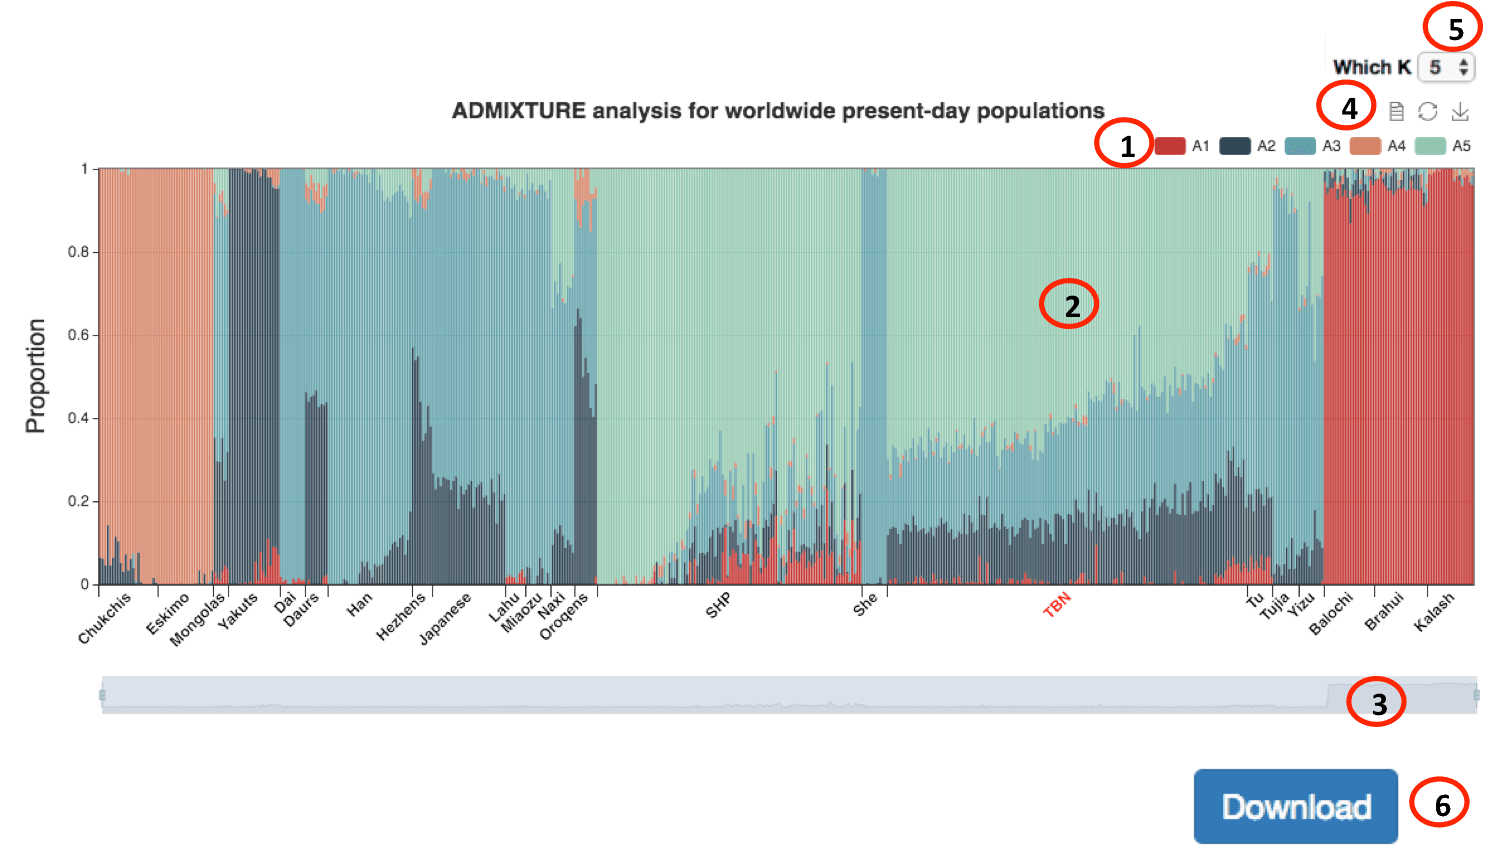
We provided several interactive website elements for each figure to enhance user experience. Here we use the ADMIXTURE part (Figure attached below) on our website as an example to provide an introduction of the interactive events, and how they can be controlled to obtain the best solution scheme.
(1). Mouse click event: Clicking on the color bars (or figure legend) will hide components represented by the corresponding color in the plot, and re-clicking on the inactive color (shown in grey) will enable it show again on the plot.
(2). Mouse hover event: Hovering on an element in a plot will trigger an information box containing detailed data about this element. For instance, by hovering a bar in the ADMIXTURE plot, users can find which
(3). Mouse wheel scroll: In ADMIXTURE and ROH plots, scrolling will zoom in/out the resolution of a specific plot, ranging from minimal 1 individual to maximal all samples.
(4). Data view and figure download toolbox: For each plot we prepared a toolbox for users to check numerical data and to download the adjusted figures. The buttons for these functions can be found upright each plot, of which the page-shaped button will open a new box containing Tab-seperated data, and the download button will convert the current plot into JPEG format and provided the download option.
(5). Option menus: In ADMIXTURE and ROH parts, we provided option menus by which users could change the ancestry (K) numbers in Admixture and the ROH length in descent. The options will change the level of analysis results and presentation.
(6). Data download button. We provided download button to each plot so that users can obtain the corresponding data underlying the figure.
 CAS-MAP Partner Institute for Computational Blology (PICB). Copyright © 2017. Email: pggadmin@picb.ac.cn